Computer Vision
Video analytics for food processing plants: overhead cameras count product, check the state of workstations, containers, and machines, and measure carcasses
The YYTECH team built and deployed five computer vision systems for fish, meat, and poultry processing, vegetable packing, and ready meals. They count product on the lines, classify the state of product, containers, and equipment, and measure carcasses from video frames.
- 5
- computer vision systems in operationYYTECH, October 22, 2026; number of systems, not a performance metric
- 4
- task types: classification, detection, multi-object tracking, keypoint detectionfrom project materials; list, not a performance metric
The problem
Plant managers need to know how much product passed each line and workstation, what state product and containers are in, what the machines are doing, and how big each carcass is. YYTECH breaks this down into four questions: How much did the line produce? What state is it in? What is the equipment doing? What size is it?
How a system works
Each system is a pipeline from frame to result: an overhead camera → monitoring zones on the frame → a classification, detection, or keypoint model → a tracker and counting rules → counters, states, and measurements on the video. Camera position, zones, and classes are set up for each station and product; the approach and the stack carry over.
Product counting
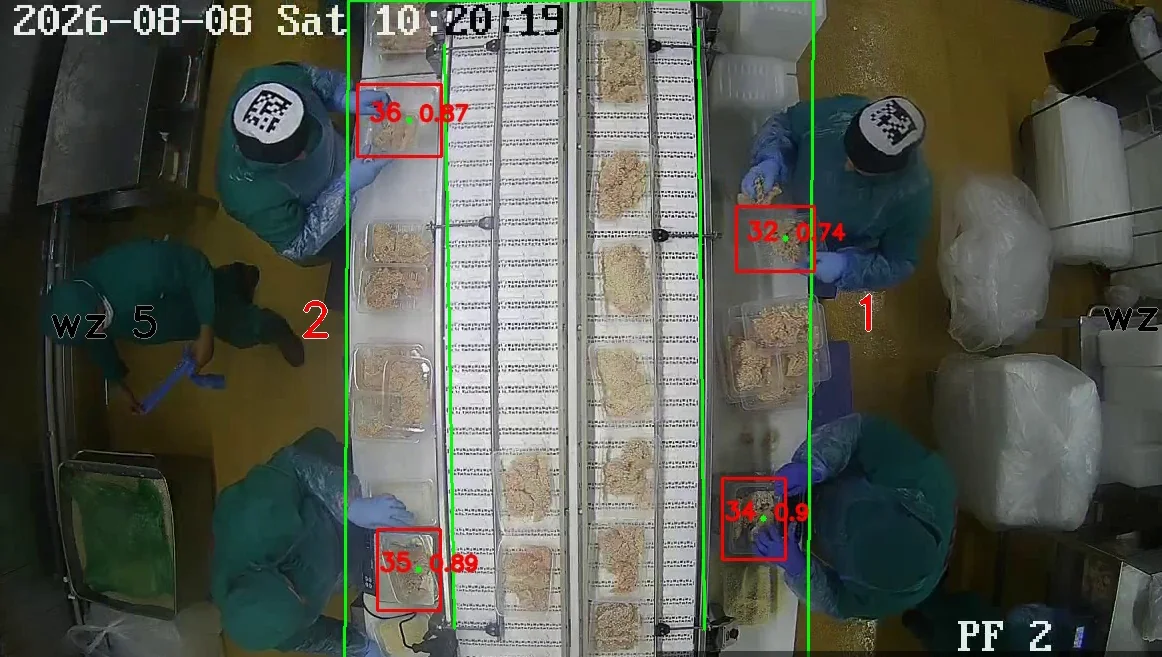
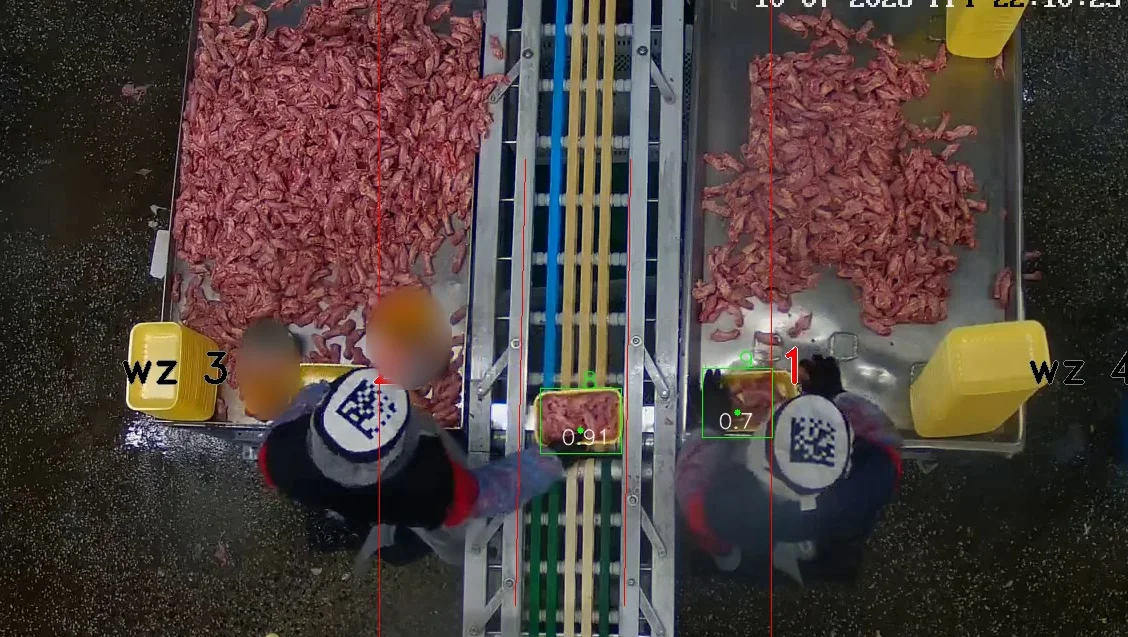
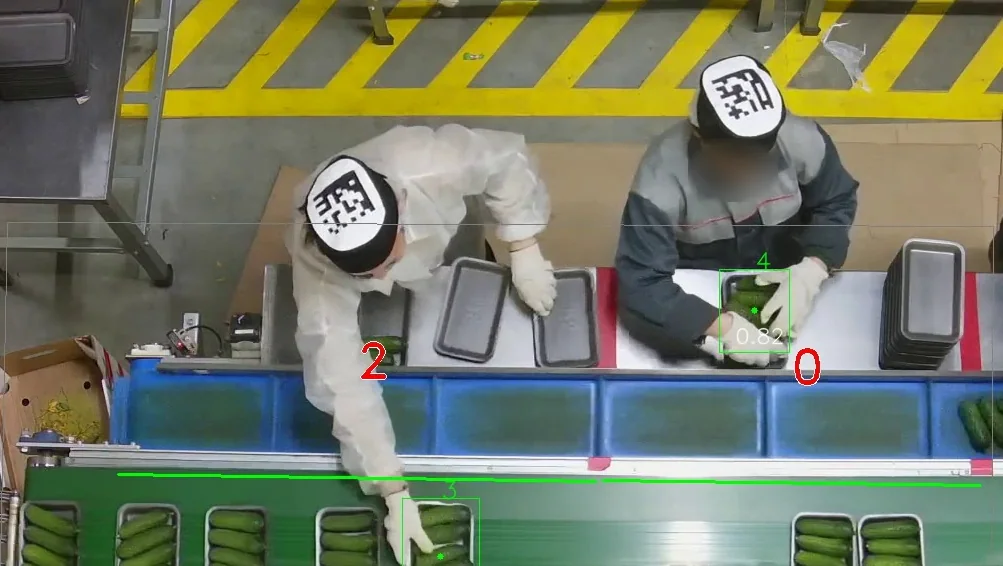
Each tray gets a track ID and is counted as it moves from the worker’s zone onto the conveyor. The system tells workers apart in the frame by machine-readable markers on their caps. The approach runs on four lines: meat products, vegetable packing, minced meat packing, and ready meals (YOLO, ByteTrack / BoT-SORT, Kalman filter).
Product and container state
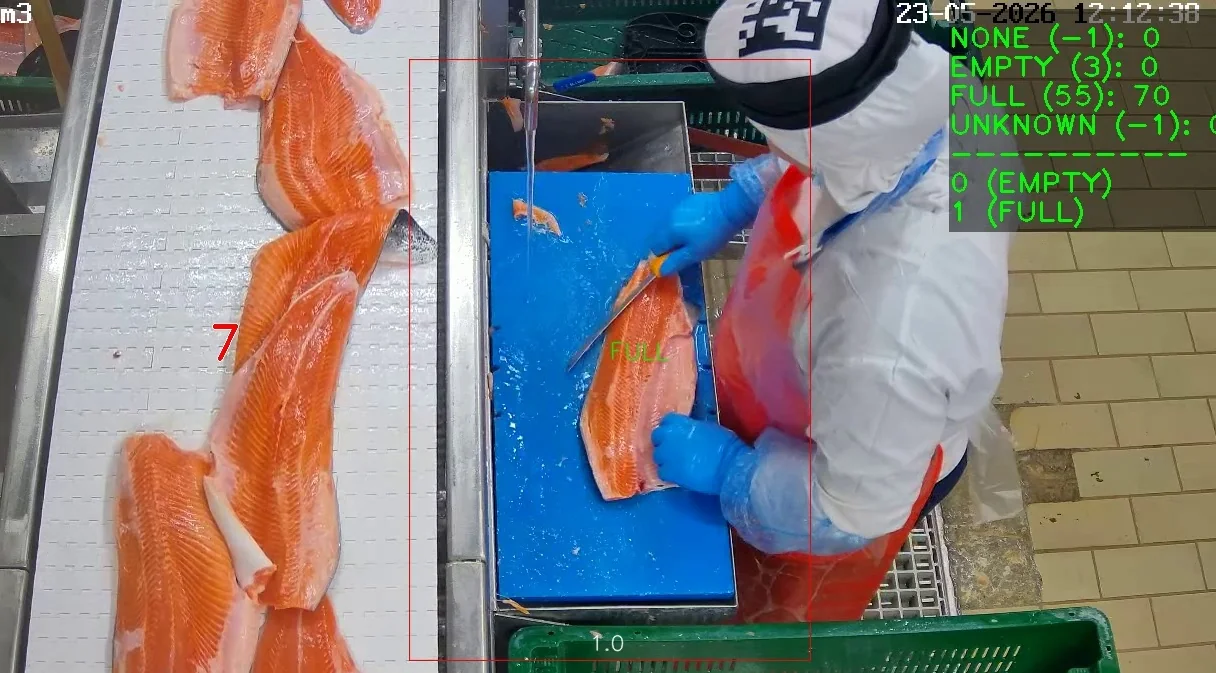
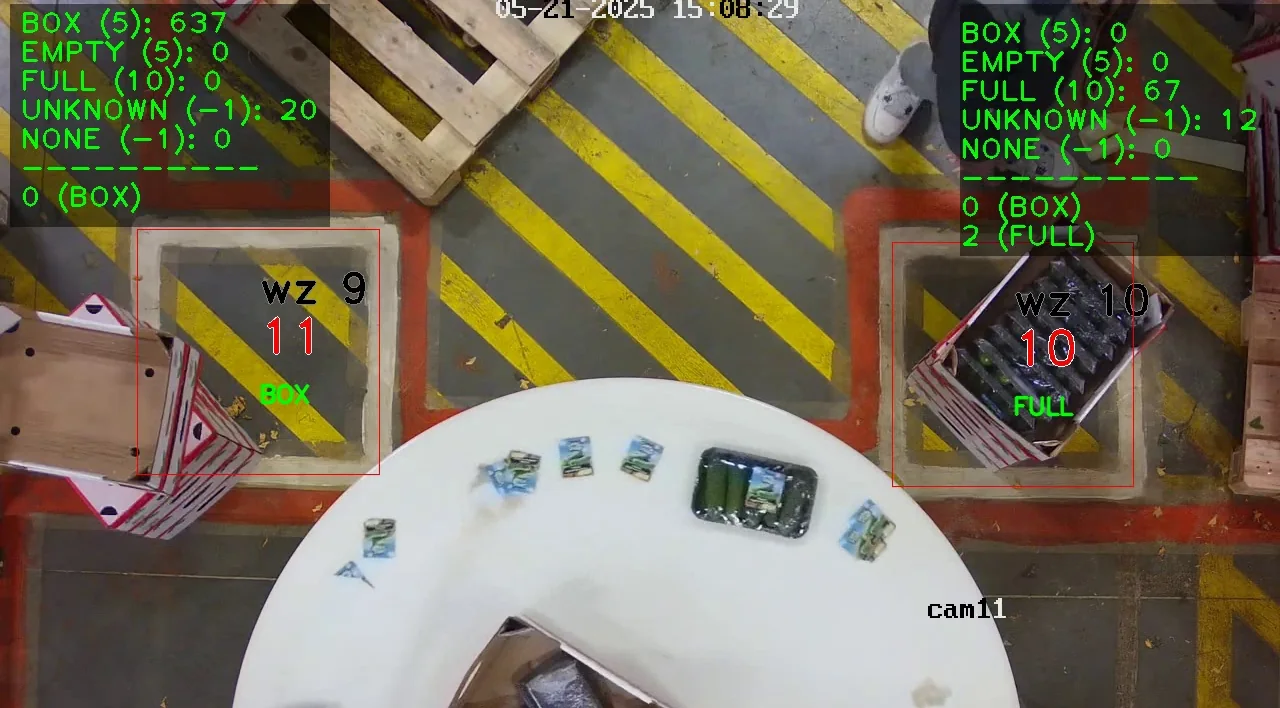
On the fish filleting line, the system tells a station with a fillet (FULL) from an empty one (EMPTY) and keeps statistics by class (MobileNet). In the packing area, it checks the container state at every station (BOX, FULL, or EMPTY) and keeps counters per zone (ResNet).
Equipment state
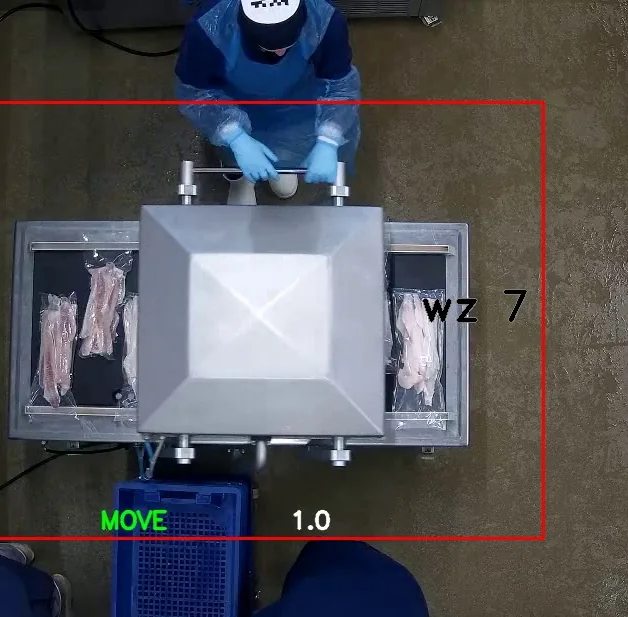
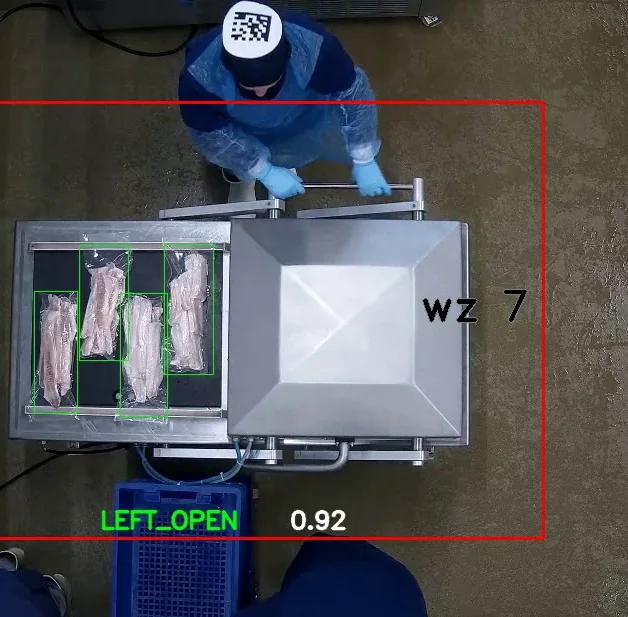
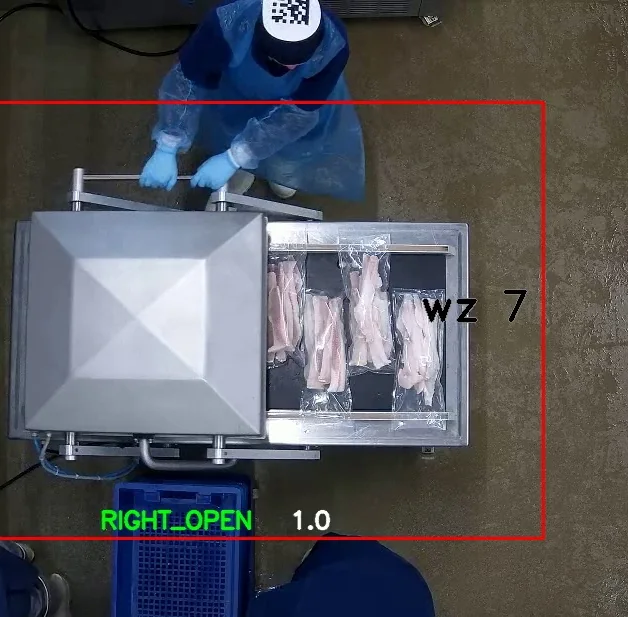
Using a camera above a packing machine, the system recognizes the mechanism positions MOVE, LEFT_OPEN, and RIGHT_OPEN and at the same time detects and counts the fish product on the open side (YOLO).
Carcass measurement
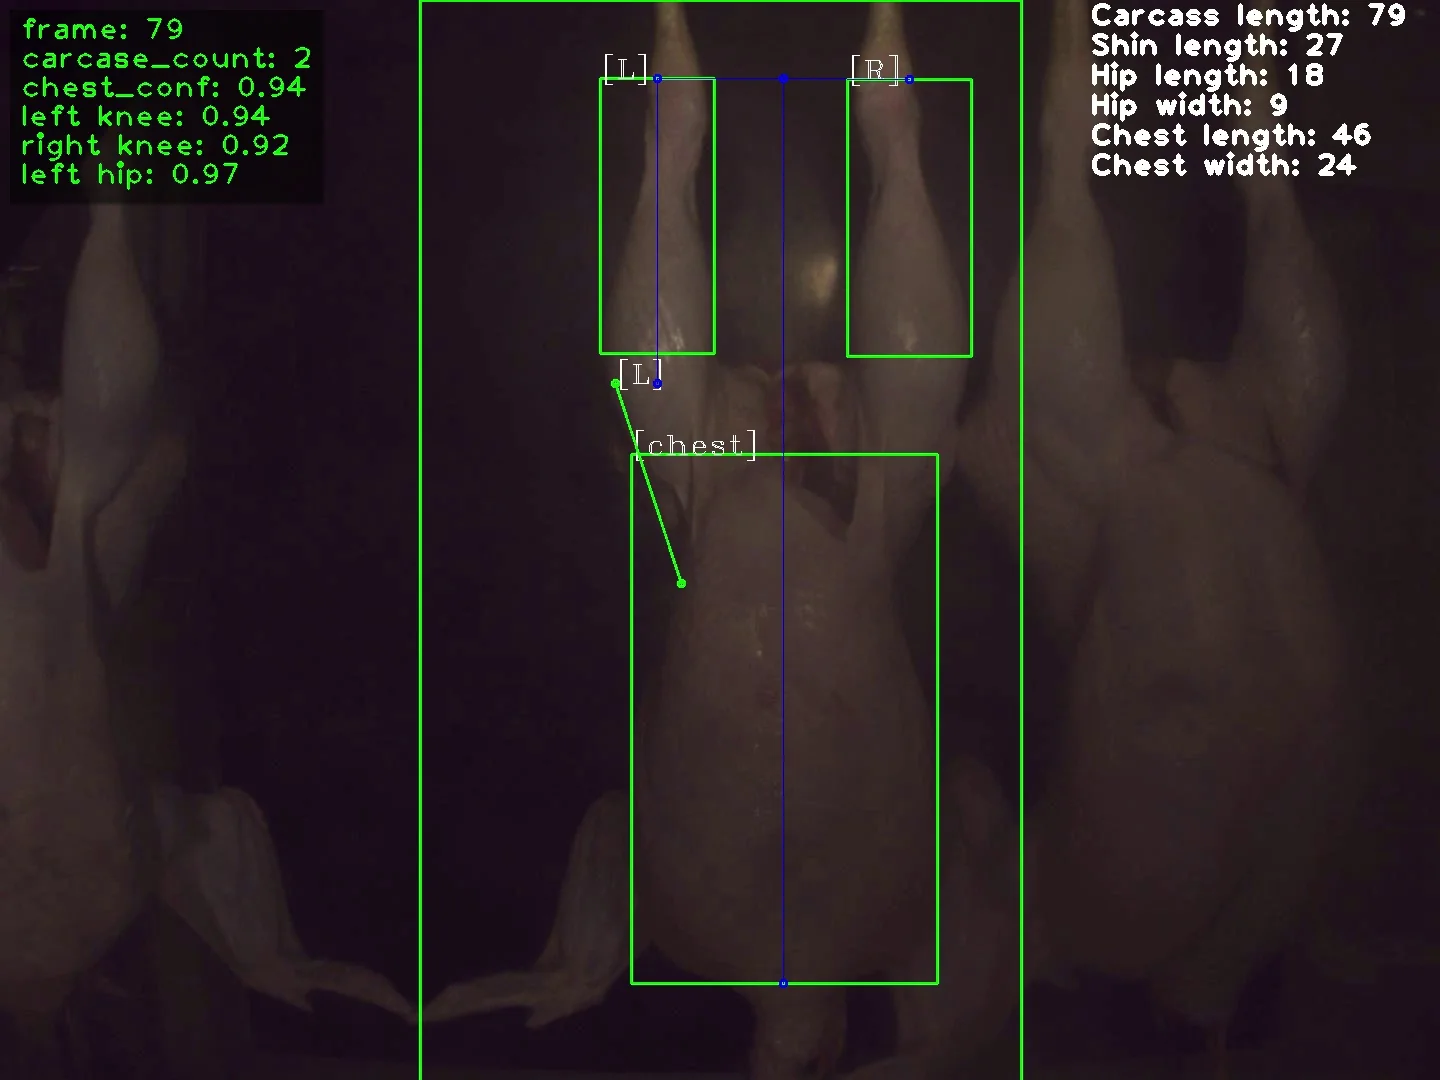
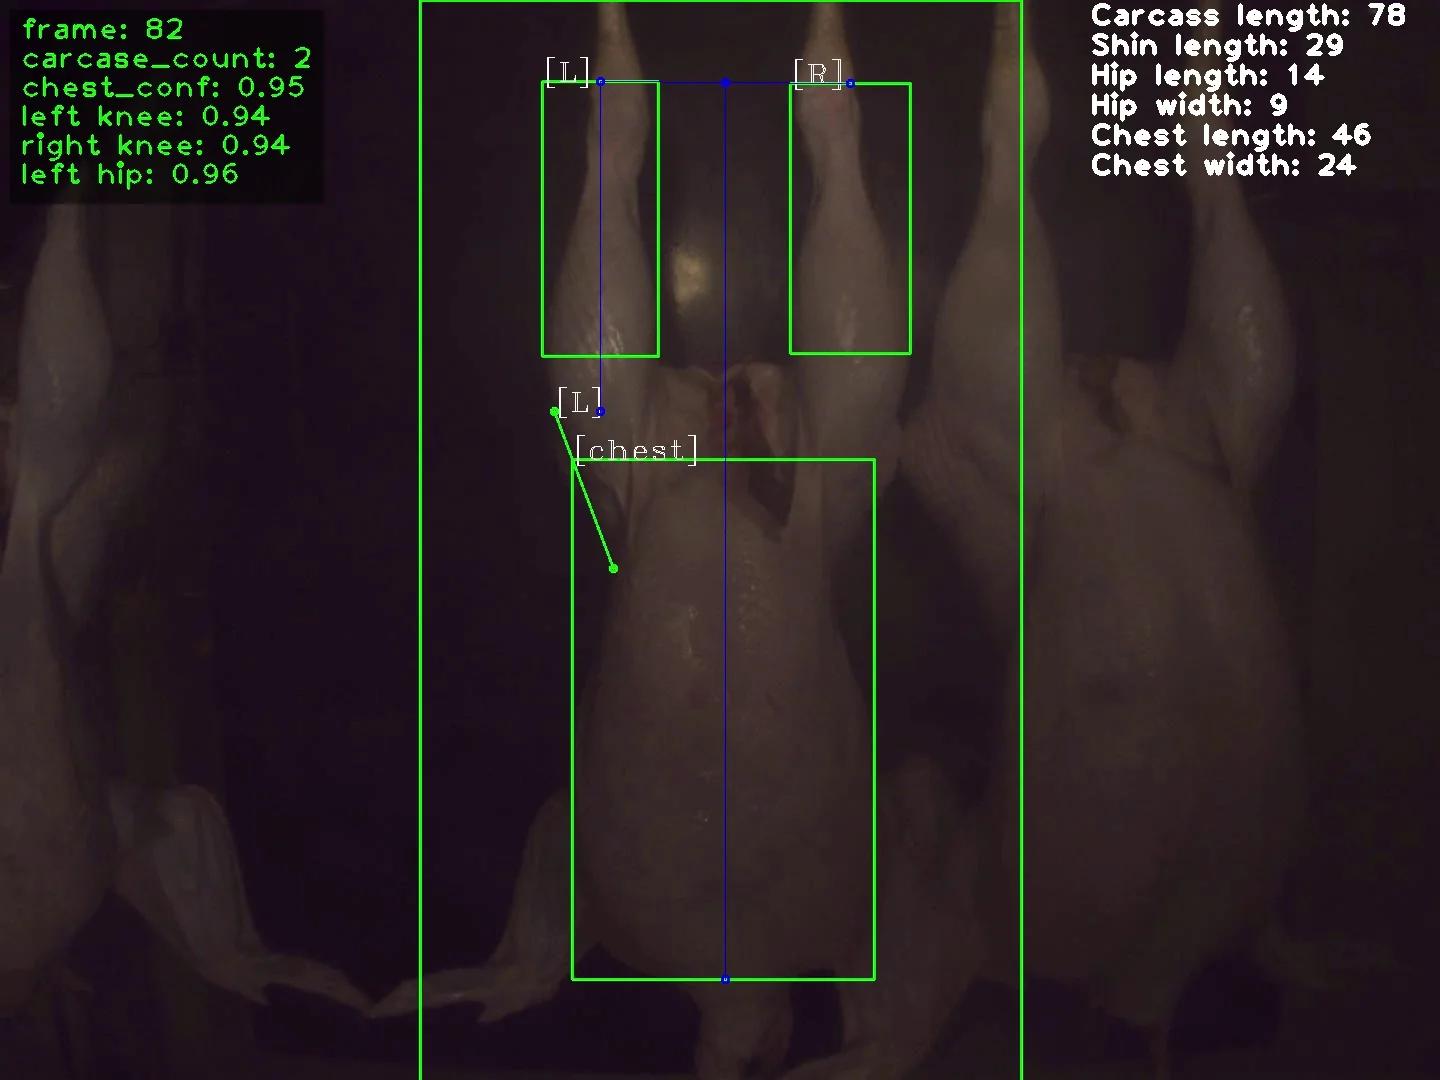
At a poultry processing plant, the system finds carcass keypoints and computes carcass length, shin and hip length, hip width, and breast length and width in every frame (YOLO Pose, NumPy).
Other tasks
Classification, detection, tracking, and keypoint models, together with segmentation and text recognition, also apply to other processes and industries. Quality: defect detection, sorting, precise object outlines. Safety: protective equipment, people in hazardous zones, violations on the shop floor. Labels and codes: labels, serial numbers, DataMatrix codes, barcodes, and vehicle plates. Motion analysis: human pose from video, joint trajectories, and action recognition, built on keypoint models as in carcass measurement.
Outcome
Five systems run at food processing plants: product counting from video, state monitoring of product, containers, and equipment, and measurement from keypoints. Overlays on the video show exactly what the system saw and counted. The same stack can handle quality control, safety, label and code reading, and motion analysis.